
You can connect Azure DevOps to Power BI using either:
- Azure DevOps Analytics Views (recommended – easy, no coding)
- OData Feed
- Azure DevOps REST API (advanced, custom reports)
Below are step-by-step instructions.
Method 1: Using Azure DevOps Analytics Views (Most Common & Easiest)
If your Azure DevOps organization has Analytics enabled and do not require to make complex calculation then this is the best method.
Step 1 — Enable Analytics in Azure DevOps(Prerequisite)
- Go to Organization Settings
- Select Extensions → Analytics
- Ensure the Analytics extension is installed (usually free). Note – if you are using free/trial account then this is enabled by default.
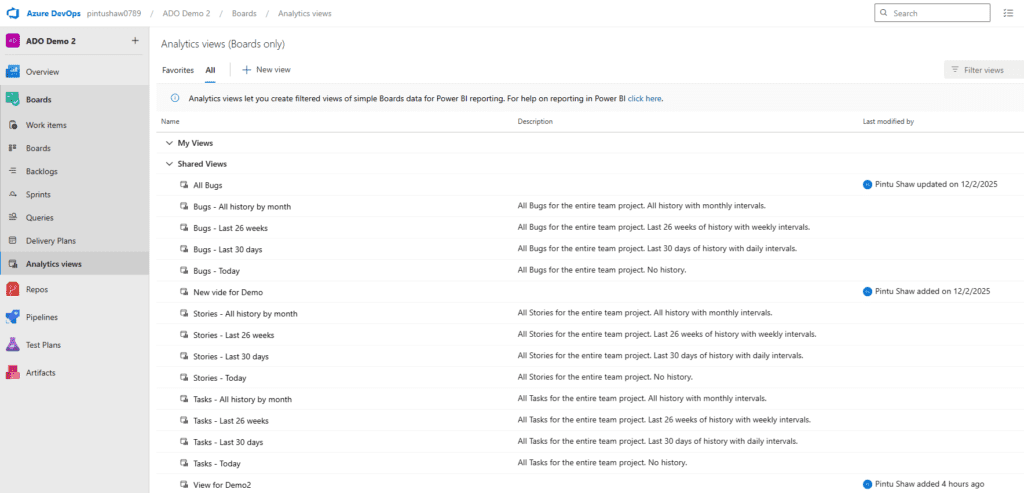
Step 2 — Create an Analytics View
Analytics Views allow customizable data filters for reporting.
- Go to your Azure DevOps Project
- Navigate to:
Boards → Analytics Views - Click New View
- Choose the dataset type:
- Work Items
- Boards
- Pipelines / Builds
- Test Plans
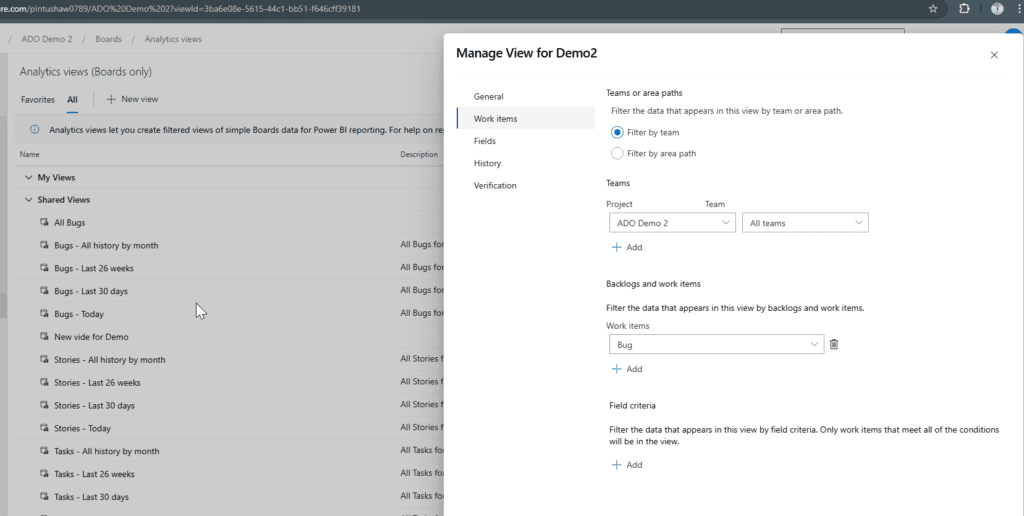
- Configure:
- Fields
- Filters
- History mode (optional)
- Save the analytics view.
Step 3 — Connect Power BI to Azure DevOps Analytics
- Open Power BI Desktop
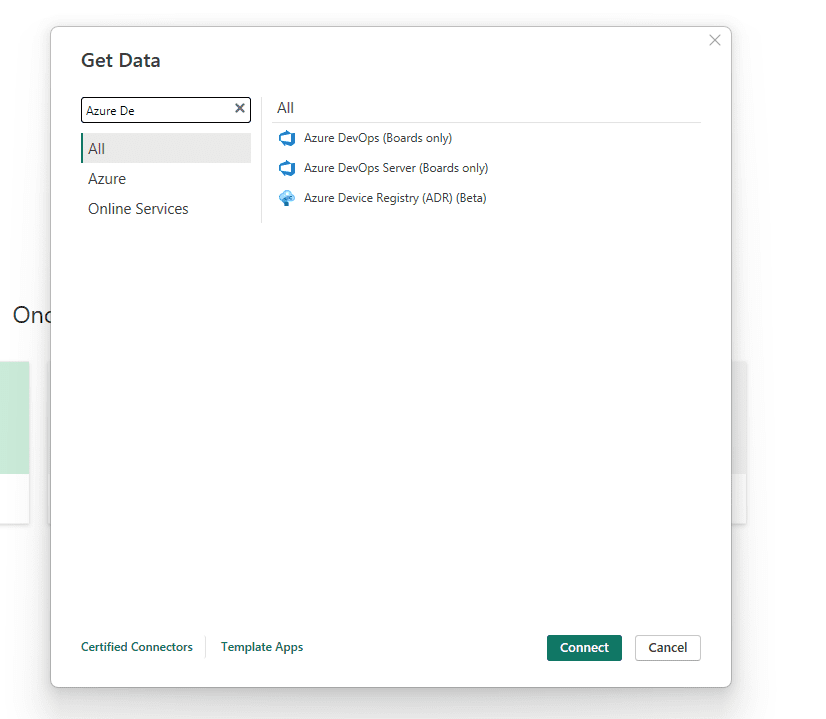
- Click Get Data
- Search for Azure DevOps
- Choose: Azure DevOps (Beta) Connector
- Sign in with Azure AD account
- Choose your Org → Project → Analytics View
- Click Load
Step 4 — Build Dashboards in Power BI
Once data loads, you can build reports like:
- Sprint burndown chart
- Story points completed
- Active bugs count
- Lead time & cycle time
- Pipeline run success rate
- Test case execution results
Use Power BI visuals: Line charts, bar charts, tree maps, KPI tiles, etc.
Step 5 — Publish to Power BI Service
- Click Publish
- Choose Workspace
- In PowerBI.com, schedule refresh:
Settings → Data Source → Refresh → Daily/Hourly
Now your Azure DevOps dashboards stay up-to-date automatically.
Method 2: Using ODATA FEED
Step 1 — Load Historical Work Item Revisions into Power BI
Use Azure DevOps OData feed:
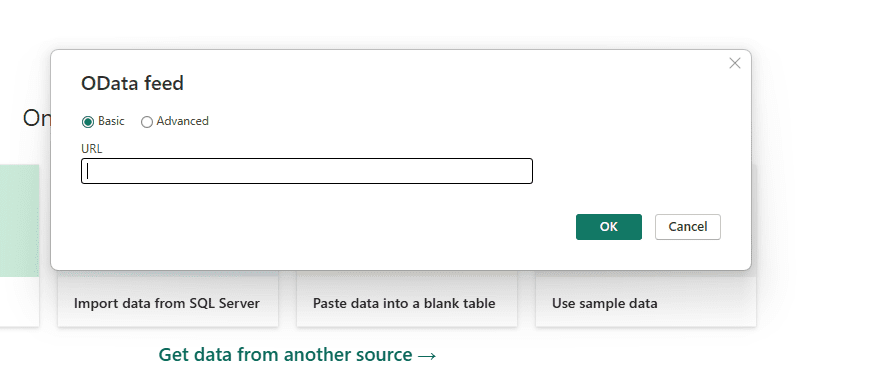
- Click Get Data → OData Feed
- Use URL:
https://analytics.dev.azure.com/{OrganizationName}/{ProjectName}/_odata/v3.0-preview- Connect using Organizational Account
Note – This only works with work account.
Example:
https://analytics.dev.azure.com/{Organization}/{Project}/_odata/v3.0-preview/WorkItemSnapshot
Replace {Organization} and {Project} with yours.
https://analytics.dev.azure.com/pintushaw0789/ADO Demo 2/_odata/v3.0-preview/WorkItemSnapshot/WorkItemSnapshot table will help you create report using historical data.
This table contains:
- WorkItemId
- WorkItemType
- State
- ChangedDate
- IsCurrent
- PreviousState (important)
# Step 2 — Filter Only Bugs (Optional)
In Power Query (Transform Data):
= Table.SelectRows(WorkItemSnapshot, each [WorkItemType] = "Bug")
Or filter manually.
Step 3 — Identify Reopen Events
Add a custom column in Power Query:
Definition of “Reopened”
A bug is considered reopened when:
- PreviousState = “Resolved” or “Closed”
AND - State = “Active”
Add this column:
Power Query M Code
- Go to Add Column → Custom Column
- Use:
= if ([PreviousState] = "Resolved" or [PreviousState] = "Closed") and ([State] = "Active") then 1 else 0
Name this column: ReopenedFlag
# Step 4 — Load Data to Power BI Model
Close & Apply.
# Step 5 — DAX Measure to Count Reopen bugs
Create a measure:
Count of Reopens (DAX)
Bug Reopen Count =SUM ( WorkItemSnapshot[ReopenedFlag] )
This gives total reopen events.
Count Reopens per Bug
Bug Reopen Count by ID =CALCULATE( SUM ( WorkItemSnapshot[ReopenedFlag] ), ALLEXCEPT ( WorkItemSnapshot, WorkItemSnapshot[WorkItemId] ))
Final Output Examples
You can now create visuals:
Table
| Bug ID | Title | Reopen Count |
|---|
Use:
- WorkItemId
- Title
- Bug Reopen Count by ID
Card Metric
Total number of bugs reopened.
Trend Chart
Reopen counts over time using ChangedDate.
Method 3: Using Azure DevOps REST API (Advanced)
If you need very custom data or you do not have work account you can proceed with this method. This method is slightly complex but most flexible.
Step 1 Create a PAT (Personal Access Token)
- Go to https://dev.azure.com/pintushaw0789/_usersSettings/tokens
- Create new token with ‘Work Items (read)’ scope (and ‘Project and Team’ if asked)
- Copy the token (you will paste it into Power BI parameter)
Step 2 Create a Parameter for PAT
Open Power BI Desktop
- Home -> Transform Data -> Power Query Editor
- Home -> Transform Data -> Power Query Editor- Manage Parameters -> New Parameter
Name: PAT
Type: Text
Current Value:
Add a Blank Query and update below Query
- In Power Query, Home -> New Source -> Blank Query
- Open Advanced Editor and paste the script from below
- Replace PAT placeholder in the sample call with the parameter reference:
PAT = #”PAT”
- Open Advanced Editor and paste the script from below
- Close & Apply to load into the model
let
    // -------- PARAMETERS --------
    Org = "pintushaw0789",
    Project = "ADO Demo 2",
    PAT = #"PAT",        // Power BI parameter (do NOT hardcode)
    EncodedProject = Uri.EscapeDataString(Project),
    // -------- AUTH HEADER --------
    AuthHeader = "Basic " & Binary.ToText(Text.ToBinary(":" & PAT), BinaryEncoding.Base64),
    // -------- GET BUG IDS VIA WIQL --------
    WiqlUrl ="https://dev.azure.com/" & Org & "/" & EncodedProject & "/_apis/wit/wiql?api-version=7.1-preview.2",
    WiqlBody = Text.ToBinary("{""query"": ""Select [System.Id] From WorkItems Where [System.WorkItemType] = 'Bug'""}"),
    WiqlResponse = Json.Document(Web.Contents(WiqlUrl,[Headers=[#"Content-Type"="application/json",Authorization=AuthHeader],Content=WiqlBody])),
    BugIdList = List.Transform(WiqlResponse[workItems], each _[id]),
    // -------- FUNCTION: Fetch Revisions for One Work Item --------
    GetRevisions = (WorkItemId as number) =>
        let
            Url = "https://dev.azure.com/" & Org & "/" & EncodedProject & "/_apis/wit/workItems/" & Text.From(WorkItemId) & "/revisions?api-version=7.1-preview.3",
            Raw = Json.Document(Web.Contents(Url, [ Headers = [ Authorization = AuthHeader ] ])),
            Values = Raw[value],
            ToTable = Table.FromList(Values, Splitter.SplitByNothing(), null),
            Expand = Table.ExpandRecordColumn(ToTable, "Column1", {"id","rev","fields"}, {"Id","Rev","Fields"}),
            ExpandFields = Table.ExpandRecordColumn(Expand, "Fields", {"System.State","System.ChangedDate","System.Title","System.WorkItemType"}, {"State","ChangedDate","Title","WorkItemType"}),
            AddWorkItemId = Table.AddColumn(ExpandFields, "WorkItemId", each WorkItemId, Int64.Type),
            ConvertTypes = Table.TransformColumnTypes(AddWorkItemId, {{"ChangedDate", type datetime}})
        in
            ConvertTypes,
    // -------- FETCH REVISIONS FOR ALL BUGS --------
    AllRevisionTables = List.Transform(BugIdList, each GetRevisions(_)),
    Combined = Table.Combine(AllRevisionTables),
    // -------- SORT BY WorkItemId + Rev --------
    Sorted = Table.Sort(Combined, {{"WorkItemId", Order.Ascending}, {"Rev", Order.Ascending}}),
    // -------- GROUP BY WorkItemId AND ADD INDEX + PREVIOUS STATE --------
    Grouped =
        Table.Group(
            Sorted,
            {"WorkItemId"},
            {{"AllRows", each
                let
                    tbl = Table.AddIndexColumn(_, "IndexInBug", 0, 1, Int64.Type),
                    tblWithPrev = Table.AddColumn(tbl, "PreviousState", (row) => try tbl[State]{row[IndexInBug]-1} otherwise null)
                in
                    tblWithPrev
            }}
        ),
    // -------- EXPAND BACK TO FLAT TABLE --------
    ExpandedFinal = Table.ExpandTableColumn(
        Grouped,
        "AllRows",
        {"Id","Rev","State","PreviousState","ChangedDate","Title","WorkItemType","IndexInBug"}
    ),
    // -------- ADD REOPENED FLAG --------
    AddReopenedFlag = Table.AddColumn(
        ExpandedFinal,
        "ReopenedFlag",
        each if ([PreviousState] = "Resolved" or [PreviousState] = "Closed") and [State] = "Active" then 1 else 0,
        Int64.Type
    )
in
    AddReopenedFlag
Add Measures
Create Measures and Visuals as below
Count of Reopens (DAX)
- Total Reopen Events (assuming table ‘Revisions’ with column ReopenedFlag)
Bug Reopen Count = SUM(Revisions[ReopenedFlag])
This gives total reopen events.
Count Reopens per Bug
— Reopen count per bug (use in a table visual with Revisions[WorkItemId])
Bug Reopen Count by ID =CALCULATE(SUM(Revisions[ReopenedFlag]), ALLEXCEPT(Revisions, Revisions[WorkItemId]))
Reopens over time (by ChangeDate)
Reopen Events (Count) = CALCULATE(SUM(Revisions[ReopenedFlag]), FILTER(ALL(Revisions), NOT(ISBLANK(Revisions[ChangedDate]))))
Bugs Reopened at Least Once
Bugs Reopened At Least Once = VAR reopenedTable = SUMMARIZE( Revisions, Revisions[WorkItemId], "Reopens", SUM(Revisions[ReopenedFlag]) ) VAR reopenedBugs = COUNTROWS(FILTER(reopenedTable, [Reopens] > 0)) RETURN reopenedBugs
Some Issues and fixes
| Issue | Fix |
|---|---|
| Analytics Views not visible | Install “Analytics” extension |
| Power BI login fails | Use Organizational Account login |
| Data not refreshing | Set scheduled refresh in Power BI Service |
| You see only 30 days of pipeline data | Switch to Full history analytics view |
Below is the link to Youtube video for step by step guide of the above.