
In this post I will show you how you can use Google sheets for stock analysis. Only prerequisite is you need to have a google account and some basic spreadsheet knowledge. Here are step by step approach to build Google sheets for stock analysis.
Step1
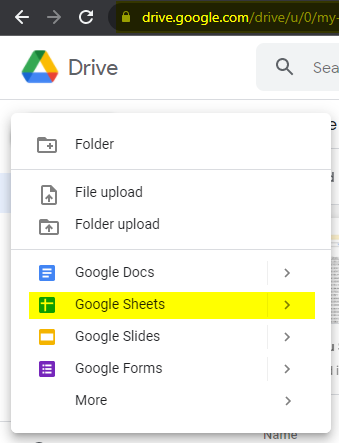
Login to your google account and open drive. From there select new sheet. Refer the screenshot below.
Step 2
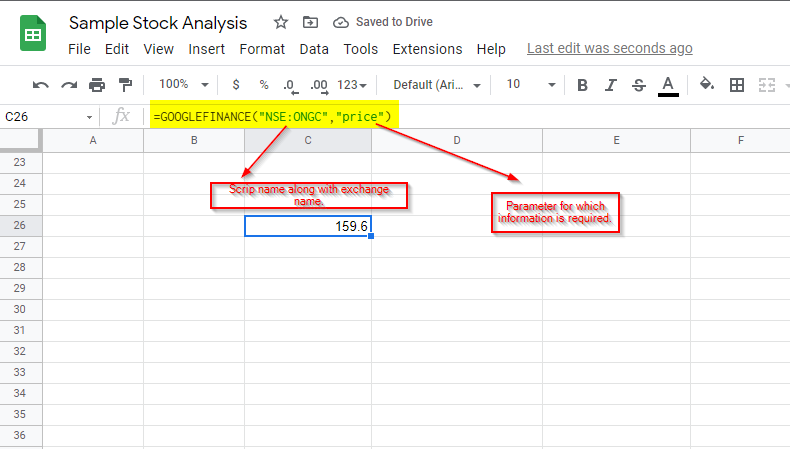
Now we will use google finance function as below.
=GOOGLEFINANCE(“NSE:ONGC”,”price”)
Note: First parameter is scrip name along with exchange name and the second parameter is what information is required. Refer the screenshot below for guidance.
Step 3
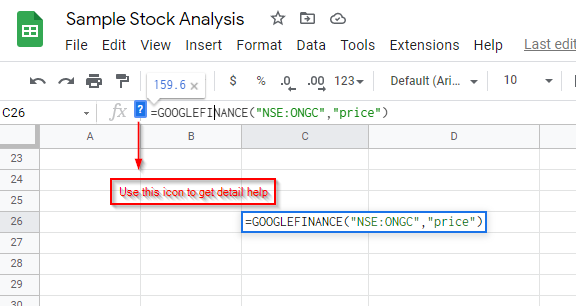
For any help in the function use the help icon next to formula bar.
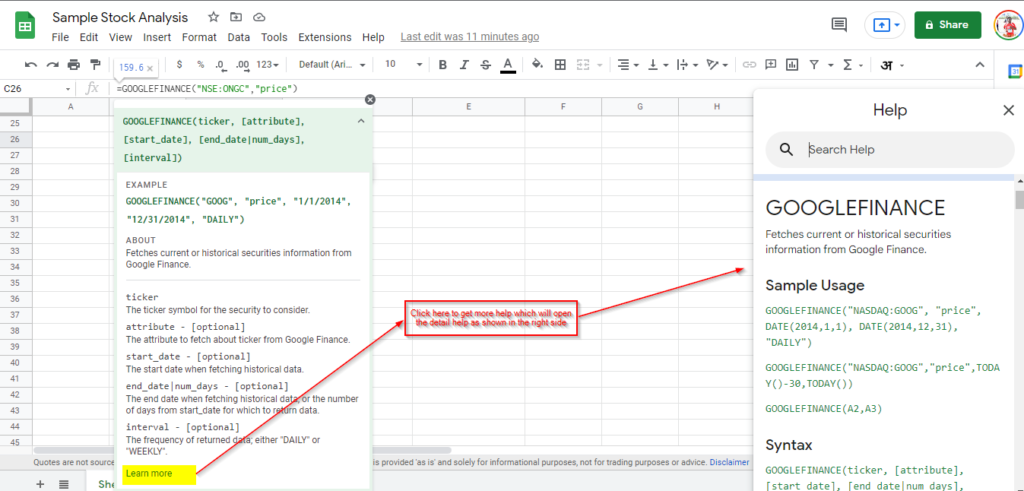
Click on Learn more to get detail help on the google finance function.
Sample Formulas to work with are as follows
- “price” – The current market price. This is the default option.
- “closeyest” – The price of previous close
- “priceopen” – The price as of market open.
- “high” – The current day’s high price.
- “low” – The current day’s low price.
- “volume” – The current day’s trading volume.
- “marketcap” – The market capitalization of the stock.